Printable paper
Logarithmic and semi-log graph paper
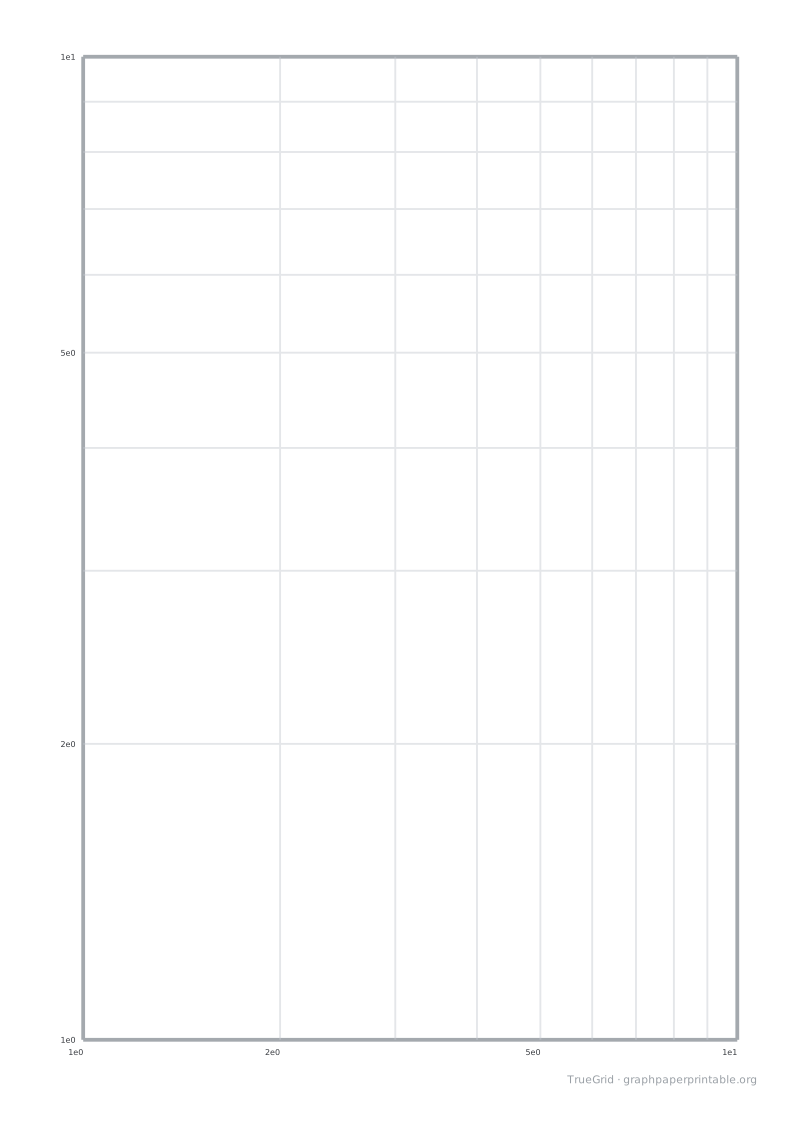
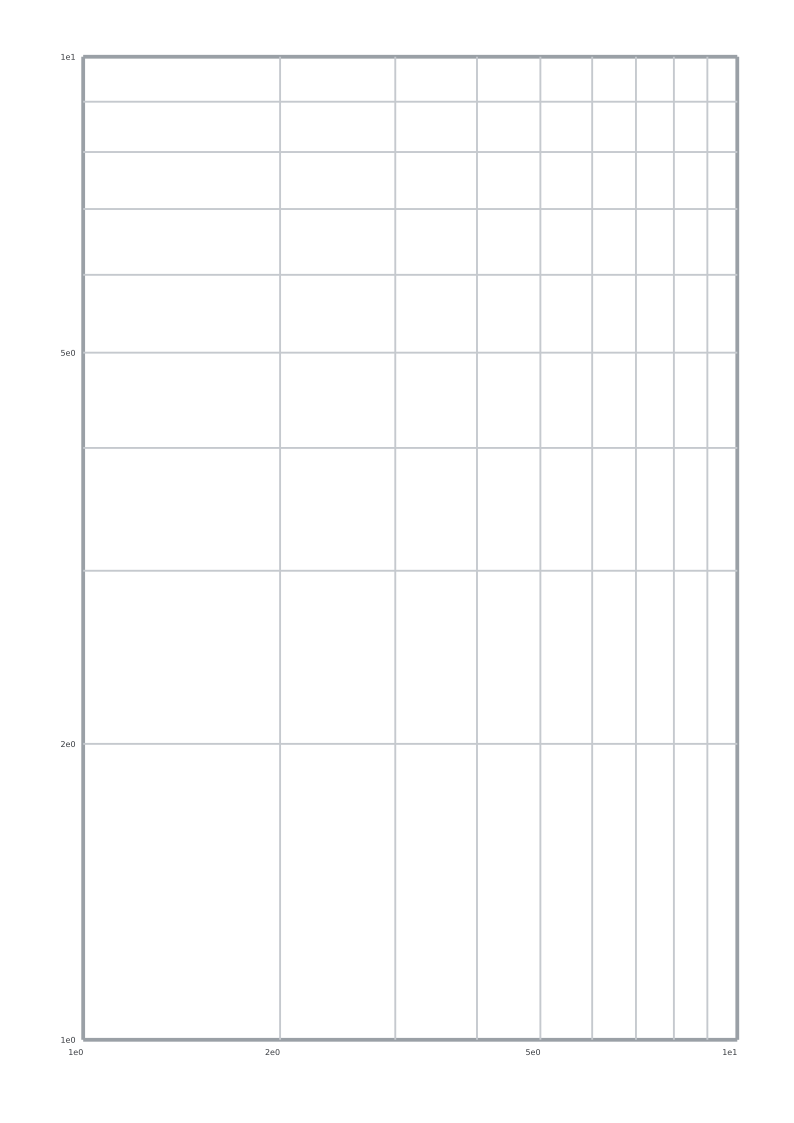
Base-10 log-log and semi-log paper for plotting ratios.
Specification
| Paper | A4 · 210 × 297 mm |
|---|---|
| Template | Log X / Log Y |
| Axis mode | log-log |
| X decades | 1 |
| Y decades | 1 |
| Drawable area | 190 × 273 mm |
| Margins | L 10 · R 10 · T 10 · B 14 mm |
| File | PDF · vector · 3 KB · no watermark on the grid |
Reading the axes
Equal distances on a logarithmic axis represent equal ratios. Within a decade, 2 sits about 30.1% of the way from 1 to 10; 5 sits about 69.9% along it. A straight line on a log-log plot can help you examine a power-law relationship.
The ready-made sheets cover 1 to 10 on each logarithmic axis. Semi-log sheets keep the other axis linear from 0 to 10. Choose the X or Y mode to match the variable spanning orders of magnitude.
Choosing ranges and labels
Customize each logarithmic axis to one, two or three decades, starting at 10^-3 through 10^3. Labels use scientific notation: 2e-1 means 0.2. Zero and negative values cannot be placed on a logarithmic axis; a negative exponent still represents a positive value.
Labels mark 1, 2 and 5 in each decade. Turn labels off to assign your own units. The printable plot reserves space for labels; increasing margins too far blocks generation rather than crowding the numbers.
Print at actual size
1Choose the matching paper size.
2Set 100%, not “Fit to page”.
3Measure the 100 mm check line.
Save and print on your device
Desktop
Open the PDF, choose Print in your PDF reader, select the matching paper size and 100% / Actual size.
iOS / iPadOS
Open PDF → Share → Save to Files. To print, use Share → Print; available controls depend on the app and printer.
Android
Open or download the PDF, then choose Menu → Print in your PDF reader. Check paper size and scaling.
Other devices
Save and open the PDF in a PDF reader. Disable automatic fitting and measure the calibration ruler.
A download click does not confirm that the file was saved or printed. Print calibration
Questions
How do I print at the intended size?
Match the PDF and printer paper size, choose 100% / Actual size, and disable Fit to page. Use a check edition and measure the 100 mm ruler before use.
Can I change the layout?
Choose Customize this paper to carry the selected template into the generator. Preview the changes before generating your PDF.